|

|
|||||||||||||||||||||||||||||||||||||||||||||||||||
Heptalysis Whitepaper
1. Foreword
In the battle of ideas those who are well positioned for creating financial gain will succeed. Whether those ventures are created by entrepreneurs as independent companies or are set up by intrapreneurs trying out new ideas inside a large corporation, we will continue to witness an increase in Innovation. Any new business venture needs financial support to become successful and for the shrewd investor, new ventures can become lucrative opportunities. To capitalize on these opportunities and support the increases in innovation, it is important to improve the efficiency of the investment decision-making processes and provide a reliable and scalable methodology for investors to rely on. Success is about wise investments and successful investment requires impartiality, consistency, as well as superior judgment and insight. Not only for investors, but also for entrepreneurs it is important to view a venture directly as an investment opportunity and consciously pursue it as such. Whether the resource is money, time or talent that is contributed, every involvee is an investor. This paper utilizes Knowledge Modeling concepts to discuss the fundamental elements of a business venture and suggests ways to systematize the screening and assessment process for investors and entrepreneurs. For all practical purposes an investment opportunity can be viewed as a machine that consumes certain resources, and produces a return within a timeline while carrying certain risk. This general view of Investment Opportunity, as shown in the above diagram, applies to all investments in the private sector ventures. This concept is detailed throughout the paper. An investment may be made with an expected return
of growth or cash flow. The valuation increase as shown above in
green symbolizes the growth of the investment. The time lapse between resource consumption and return will largely depend on the type of industry, company strategy, success in execution and stage of development.
In a perfect world, an investor would ask only three questions before making an investment decision:
However, in the real world, investors have experienced or heard of cases where investments haven’t produced the promises. So they now have to quantify the risk by asking questions such as:
And that is where all the complexity of selection begins . . . Risk/Reward model – all investment factors drive this universal model. The concept of investment is embedded within the “Risk/Reward” model of wealth creation. It is commonly accepted that a higher risk tolerance correlates to a higher potential of reward. The following diagram illustrates possible opportunities in relation
to their Risk/Return ratio. 
Of course any investment involves certain level of risk. However a sound investment decision should incorporate a calculated risk. As the level of risk increases, the range of possible returns on the investment widens as shown in the diagram below. 
Noteworthy, the quality of an investment opportunity is not determined only by its level of return, but also by the certainty of its risk level. In other words not every low yielding investment is a bad investment and vice versa. The calculated level of risk is usually the biggest driver for an investment’s required rate of return. The riskier the investment, the higher the rate will be in evaluating whether the expected payoff will be sufficient. The table below shows what one dollar of investment will need to grow to given the level of risk and expected time to a liquidity event. For a highly risky investment requiring a 60% annual rate of return, the payoff in one year needs to be 23% higher than a less risky investment that requires a 30% annual rate of return (1.6 / 1.3 - 1). Because the payoff for investing in a private company often takes four or more years to realize, it is important to recognize that as the riskiness (required rate of return) of alternative investments increase, the size of the payoff grows at an even faster rate for multi-year investments. At four years, the payoff on an investment requiring a 60% rate of return will need to be 129% higher than the investment that requires a 30% rate of return.
Ideally the risk/reward values are reasonably known and predictable. However for early stage businesses that is usually not the case. Because of the impact risk has on the size of the payoff over time, it is important to try to measure the uncertainty of an investment outcome. How does one go about doing this? The best way of answering this question is by using stochastic methods for calculating expected return and distribution variance. Expected return is defined as the sum of probability of each possible outcome (probability distribution) multiplied by its payoff. Expected return represents the average return one "expects" to receive if investments with identical odds are repeated many times. A situation with expected return of zero (no net gain nor loss) is called a "fair game". For example, assume that the potential return on
investment (ROI) in a Start-up company is predicted as followed:
That will translate to an expected return of 15% (0.1 * 5 + 0.15 * 1 + 0.25 * 0 + 0.5 * -1) The variance and standard deviation describe the dispersion (spread) of the potential outcomes around the expected return, which correlates to degree of uncertainty or risk. The larger the spread » The higher the risk Variance is defined as the sum of probability of
each possible outcome multiplied by squared deviations of each outcome
from expected return.
 Usually no investment is undertaken unless the expected rate of return is high enough to compensate investors for the perceived risk of the investment. The required return is composed of “risk-free” rate of interest plus several premiums that reflect inflation, the riskiness of the investment, and liquidity of the investment. This relationship can be expressed as follows: Required Return = Riskfree Interest Rate + Inflation Premium + Risk Premium + Liquidity Premium Riskfree Interest Rate = the real risk-free rate of interest is the rate that would exist on a riskless investment if zero inflation were expected. Inflation Premium = IP is equal to the average expected inflation rate over the life of the investment. The expected future inflation rate is not necessarily equal to the current inflation rate, so IP is not necessarily equal to current inflation. Risk Premium = This premium reflects the possibility that the investment will not pay interest or principal at the stated time and in the stated amount. Risk Premium is zero for U.S. Treasury securities. Liquidity Premium = This is a premium charged by investors to reflect the fact that some investments cannot be converted to cash on short notice at a "reasonable" price. Liquidity Premium is very low for Treasury securities but it is relatively high on very small firms. It is to consider that risky investments rarely produce their expected return; they earn either more or less than what was originally expected.
 In general assessing risk is a complex issue because there is a myriad of factors involved. In the venture and corporate investments the number of contributing attributes as well as the complexity of risk assessment is much higher. There are factors involved such as market needs, feasibility of the solution, management’s ability to execute and barriers to entry. A careful examination and breakdown of composite elements is the first step to gather needed insight required for decision-making.
2. The Venture - A Profit MachineFor purpose of this paper we break down a business venture into seven fundamental elements contributing to its expected outcome. 
A venture works just like a profit-making machine, consuming various resources as input and producing a certain financial profit as output; presented as “a function of time”. Even though it may sound obvious, many still ignore the time dimension and make investment decisions based on a two-dimensional snapshot in time. 
The time dimension and type of return vary depending on the stage, type, and strategy of a venture. Investors should always keep the timeframe and return type in focus. The return can be immediate or delayed and manifested as growth or cash flow. The venture’s management team is responsible to plan for
maximum profit and minimum risk and prove to Investors the plan’s
validity.
3. Assessment ElementsInvestment decisions are based on risk/reward ratio. However unless potential risk and reward can be accurately estimated it is very hard to make a sound judgment. The purpose of investment screening is to determine the fitness of an investment opportunity with respect to specific investment preferences. It helps to qualify the potential rate of return and quantify the associated risks. A systematic investment screening and assessment methodology not only assists investors in making investment decisions, it also helps entrepreneurs in their planning process. Proper assessment is about moving from uncertainty to certainty and likelihood and certainty. To assess a venture with a systematic approach, all contributing elements have to be examined independently; that is,

The model will show how well each of the seven elements contributes to the total success of the venture. The set value along each axis represents the viability
of such element. A graph is constructed so that a perfect investment
opportunity corresponds to a fully symmetric heptagon as shown below
in yellow. However most investment opportunities will have a deformed
shape like the purple-shaded area. 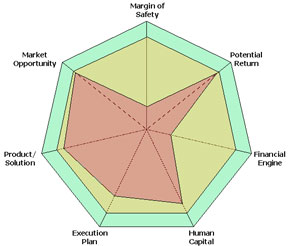
The specific value of each contributing element is produced by answering specific questions and to score the element’s ability to fulfill the desired promises accordingly. These questions are slightly different depending on industry and revenue stage of the venture. For the purpose of calculation the elements are scored in full if not applicable in specific cases. In the following section each assessment element is individually described and reviewed. For a more accurate reading each element is broken down into sub components, which collectively produce a judging of the main element.
4. Mathematical ModelThe purpose of a mathematical model is to help both entrepreneurs and investors measure and compare investment opportunities in a consistent and systematic way. Investment decisions are entirely subjective and cannot be generalized. However, the proposed analytical models can help investors to develop, test and standardize their own internal model. For this reason, the assessment is best started by assigning a numeric value to each element of the model. This will describe how well each of the seven elements is positioned to contribute to the total success of the venture. It has to describe the availability or ability of the element to deliver the promises. The value is selected from a range of 0 to 100, with 0 being "the worst" and 100 being "the best". Accordingly, the total score of a venture is calculated as follows: Score = (O + S + E + H + F + R + P) / 7 with O = Market Opportunity In addition the model is able to capture the confidence level of assessment. In the following graph the blue line represents the score of the elements, while the red line represents the confidence level relative to each one. The yellow area represents the area of uncertainty.  A maximum confidence level will cause the red line to overlay with the blue line and minimize the yellow uncertainty area. As such the total confidence level of a venture is calculated as: Confidence = (CO*WO + Cs*Ws + CE*WE + CH*WH + CF*WF + CR*WR + CP*WP)/ WTotal with
The weights of the criteria are usually determined on a subjective basis. These weights represent the opinion of a single decision maker or synthesize the opinions of a group of experts using a group decision technique. Furthermore, the model can capture the fitness of opportunities in accordance with the importance of the elements to each investor rather than treating them equally. While some investors might be more intrigued by the market opportunity, others may put more emphasize on the team.

To incorporate that aspect of an investor’s preferences the model utilizes a weighting mechanism. The weights are captured and presented in the graph as thickness of lines corresponding to each element. Fitness is calculated as: Accordingly, assessment can consistently result in a spider graph as well as a short description detailed as: $500K – Biotech – 30% Growth – 3Y Exit – Score:
65 – Confidence: 45 – Fitness: 78 The above example includes the capital requirement, industry and potential returns, along with a visual representation of potential risks and weaknesses. To increase the accuracy of assessment each element of the model can be examined using the same heptalyzation model. As described in chapter 4, each element is assessed using quantifying questions. These sub-elements can be scored and weighted in the same manner as in the core elements. This sublevel scoring can automate the calculation of higher-level scores and confidence levels. For example element "A" is examined using questions A.Q1, A.Q2, A.Q3, … where each question is again represented with a score, a confidence factor and a weight. 
Accordingly the score and confidence level of "A" can be calculated as: 
With
The sub-scoring concept can be applied to as many levels as needed. While this framework is still vulnerable to judgment errors, it provides a methodology that can be continuously improved and adjusted in accordance to the user’s experience. A working model of the heptalysis is available on www.heptalysis.com
5. Score, Confidence and Weight CriteriaIn its simplest form, a single user can derive a Heptalysis score by rating each of the sub-factors. With each factor having 7 sub-factors of its own, a user will rate 49 sub-factors in order to yield a score, confidence and weight. But how does a user score each sub-factor? What constitutes a score of 100? How do you put a numerical score on sub-factors such as Ethics & Integrity or Vivid Pain or Desire? All these questions are valid in that they point to the ambiguity of an unbounded assessment methodology. This chapter will try to outline a standardized quantification method, describe the drawbacks of a single user assessment and explore alternative scoring methodologies to enhance the assessment’s pedigree. Scoring the Sub-Factors: A Standardized Approach A wise person once said
“one man’s trash is another man’s treasure.”
In the case of Heptalysis, it should be “one person’s score
of 100 is another person’s score of 50.”
A major hurdle encountered by any assessment methodology
is that people conduct the assessment, and these people make judgments
based on their personal history, academic and professional background.
These judgments can vary widely from person to person. Therefore, the usefulness of Heptalysis is lost if one assessment
cannot be compared to another.
For an assessment to be repeatable and comparable across
all users, it must have a standardized input methodology. A simple way to standardize the input is to prevent the user from simply picking the sub-factor score. This is usually accomplished by developing a set of questions that, collectively, will produce a score for the sub-factor. This methodology controls the scope of the sub-factor, and ensures that the assessor will take into consideration everything needed to accurately derive a score. These questions can be thought of as sub-sub-factors in that they are just derivatives of sub-factors.
The Panel of Experts Technique The Panel of Experts technique overcomes many of the downfalls presented by the single user assessment. The process is fairly simple: gather a group of industry experts and have them conduct the same assessment independent of each other. The result is a sample of scores for each sub-factor. This technique is commonly used in the aerospace and defense industries in conducting quantitative risk assessments on complex systems involving multiple disciplines. For example, it would be nearly impossible for one person to accurately assess the financial risk on the development of a new surface-to-air missile. To do this, the user would need in depth knowledge of aerodynamics, electrical engineering, mechanical engineering, software design, manufacturing, logistics, contract law, finance, etc. Rather than searching the globe for this all knowing individual, it is much easier to form a team of experts representing the various disciplines involved. Benefits of the Panel of Experts technique:
Drawbacks of the Panel of Experts technique:
Overall, the Panel of Experts technique is a great way to add certainty to a Heptalysis assessment. Implementation could come in several forms. The panel of experts could be the general partners of a venture capital firm, local business leaders paid for their time, local MBA students, or some kind of Heptalysis member association. Example: Panel of Experts This technique can be
set up using the following table from Microsoft Excel©. 
This particular example has an overall score of 82.6, a derived confidence of 90%, and a weighted score of 74.5. Benchmarking Technique Another alternative to the single user assessment is benchmarking. Benchmarking is the process of comparing the attributes of a particular venture against the attributes of another venture, known as the benchmark. Ideally, the benchmark venture has completed its life cycle with relative success and can therefore be assessed in hindsight. In hindsight, one will likely have better judgment of which sub-factors the benchmark excelled in as well as which sub-factors the venture lacked in. Once assessed, the benchmark can be used as a measuring stick to rate new ventures. For example, let us assume the benchmark venture received considerable success in marketing its product. The benchmark was rated, in hindsight, a score 85 in its sub-factor Marketing and Promotion Plan. Let us also assume the new venture has done everything the benchmark did in terms of marketing and promotion, and has also developed a new direct mailing system that is expected to have a significant effect on sales. In theory, this new venture should be rated at least 85, if not higher based on this comparison. This process is then repeated for each sub-factor to yield an overall score. Benefits of the Benchmarking technique:
Drawbacks of the Benchmarking technique:
Overall, benchmarking is a great substitute for the single user assessment. It is a more quantitative methodology, which leaves less room for subjectivity and human judgment. It also allows for continuity across multiple assessments. But, perhaps the biggest drawback of the benchmarking technique is that it fails to quantify confidence, which is left to the user to subjectively derive.
This technique can be
set up using the following table from Microsoft Excel. 
Summary Both of the aforementioned techniques increase the certainty and accuracy of a Heptalysis assessment. The Panel of Experts technique is a fundamentally sound methodology of assessing a venture with implementation being its only drawback. Benchmarking is also a great method of deriving sub-factor scores; however, it fails to sufficiently address confidence.
6. DisclaimerThis paper does not provide investment advice, and should not be relied on as such nor is it a substitute for investment advice. The statements and opinions expressed here are solely those of the author and are not intended to constitute professional advice. Any reliance upon this paper shall be at the user's own risk, without any recourse to the author and his associations.
7. AcknowledgementsThe author would like to thank Nikolay Stanevski who created the first heptalyzer engine, Jon Brager for his contribution to criteria solutions and Prof. Mike Solt, Dr. Rolanda Pollard and David Belgum for their support and contributions to the project. Thanks are also due to the people who reviewed
the draft paper, and who gave feedback, which helped to correct
some errors and polish the final document. The author expresses
special appreciation to Silicon Valley Entrepreneurship Center and
other individuals who shared knowledge and wisdom with this study.
This paper is more comprehensive, and richer in its insights, thanks
to the willingness and generosity of many people to share their
knowledge and views.
8. AuthorPejman Makhfi is a Silicon Valley technology veteran, serial entrepreneur and angel investor in the high-tech industry. Pejman has more than fifteen years of progressive experience in providing consultancy services and best practices to entrepreneurs, technology investors, and forward-thinking Startups. Widely known as a leader in the field of Business Process Automation and Knowledge Modeling, Pejman has an extensive background in the software and financial industries and has been the key architect for several award-winning industry leaders, such as FinancialCircuit and Savvion. Today, Pejman is the Director of Venture Development at Singularity Institute, Managing Director of a private investment group and is a member of Venture Mentoring Team where he provides assistance and guidance to several early-stage companies. His background includes executive position at TEN, a top Silicon Valley technology incubator hosting more than fifty Start-ups. Pejman managed TEN’s R&D as well as advised startups on the issues and trends affecting early stage and emerging growth companies. Since its inception, TEN has helped launch over sixty Startups, including eBay, iPrint, Xros, Vertical Networks, Right Works, and Intruvert Networks. Mr. Makhfi holds a B.S./M.S. degree in Computer Science from Dortmund University in Germany and is an internationally licensed Project Manager (PMP) as well as a certified Lean Six Sigma Black Belt (SSBB) in continuous business improvement. He has authored multiple Patents and standards and is an active contributor to organizations such as "IEEE Neural Networks Society", "American Association for Artificial Intelligence" and "American Society for Quality".
9. CopyrightThis paper is copyrighted by the author and distributed through Heptalysis.org, and VentureChoice.com, but it may, by the author's permission, be freely downloaded, translated, printed, copied, quoted, distributed in any appropriate media providing only that it not be altered in any way in text or intent and the author is properly credited.
10. References
2. 10 Biggest M&A “Bloopers” in 1998, The Year of The Mega-Merger, Dec 1998, < http://findarticles.com/p/articles/mi_m0EIN/is_1998_Dec_18/ai_53432333>, (6 December 2007), Business Wire
|
||||||||||||||||||||||||||||||||||||||||||||||||||||
| Home | Whitepaper | Order Heptalysis | Practitioners | Contact Us | Login Copyright © 2005- 2010. All rights reserved. |